June fund outputs show healthy deficit management
The Ministry of Finance (MoF) statement of fiscal operation for June 2025, framed a picture that blends solid domestic revenue collection with deliberate expenditure control and disciplined borrowing.
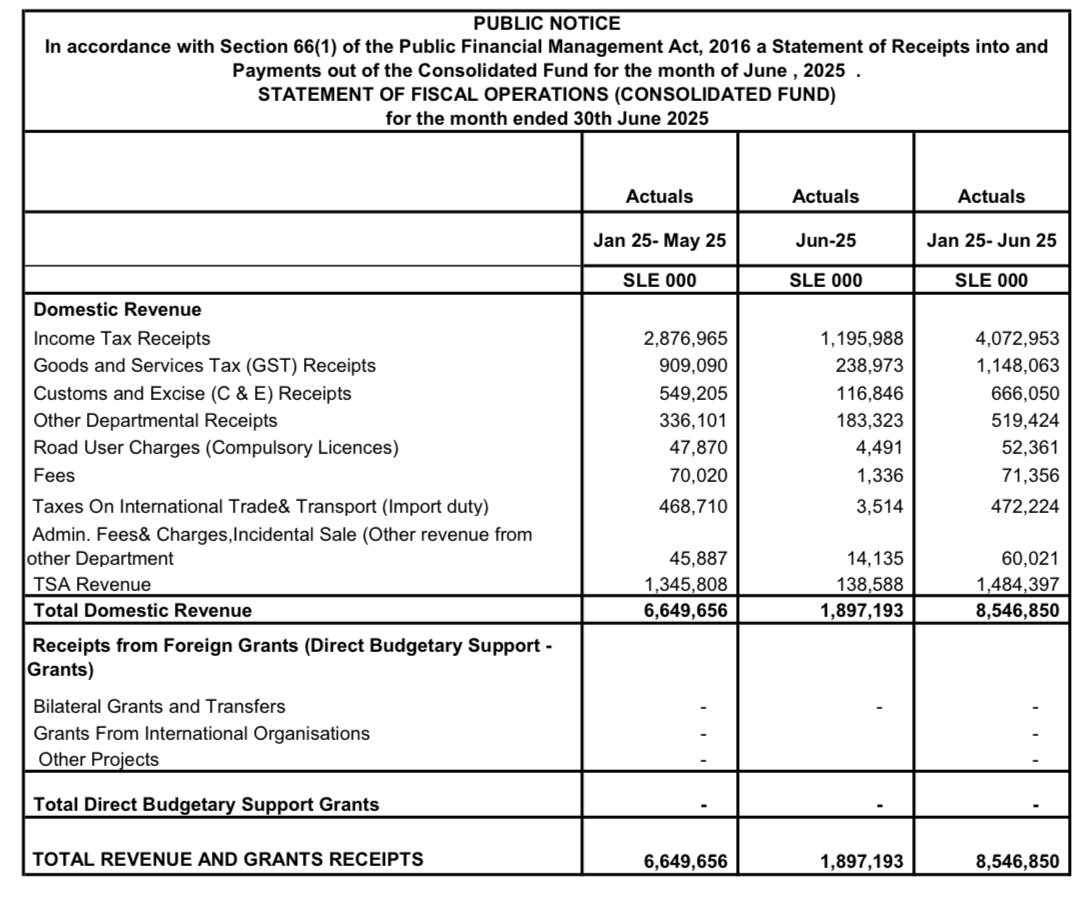
Domestic revenue totalled 6.65 billion SLE (Jan-May 2025) plus 1.90 billion SLE in June, bringing the first half of 2025 to roughly 8.55 billion SLE in total revenue and grants. The breakdown shows tax receipts continuing to underpin the fiscal base: income tax, GST, customs and excise, and other departmental receipts collectively supported the bulk of inflows.
The receipts mix reflects a typical budgetary pattern for this period, with a robust run rate in direct budgetary support from foreign sources represented in the June line items, though overall grant receipts for direct budgetary support remained modest in the June snapshot. The table underscores the government’s reliance on a combination of domestic tax and foreign support to close gaps between revenue and expenditure.
Total expenditure and lending costs stood at 8.91 billion SLE for Jan-May 2025 and 2.26 billion SLE of negative net expense for June, reflecting the seasonality and monthly aggregation of payouts. The six-month tally shows non-interest recurrent expenditure and capital outlays shaping the overall burn rate.
Wages, salaries and employee benefits came to approximately 3.51 billion SLE for the six-month window, underscoring continued staff costs as the dominant recurrent expense. Within this, social security contributions were modest in the six-month period, highlighting payroll-related obligations without excessive spikes.
Non-salary, non-interest recurrent expenditure, transfers and grants, and specific allocations to tertiary education institutions, road fund transfers, local councils, and TSA agencies punctuate the government’s discretionary spend. The data suggest a deliberate prioritization of social, infrastructure, and governance-related transfers even as other areas tighten.
Capital expenditure and financing costs feature prominently, with domestic interest payments and external debt amortization shaping the cost of financing. The six-month data indicate substantial domestic financing activity, including a notable bridging loan and treasury bill movements, which collectively illustrate liquidity management and short-term borrowing strategies.
Net financing flows reflect the period’s funding dynamics, including ways and means instruments that absorb or release liquidity. The June data reveal a swing in net financing, consistent with the government’s ongoing debt management framework and liquidity planning.
The document notes a cash surplus/(deficit) from operations, with a specific figure showing the operational cash balance after accounting for all outlays. The presence of contingency expenditure and cash arrears further illustrates a governance framework that plans for contingencies while maintaining accountability.
Overall, June’s data imply a balanced approach, revenue streams cover a meaningful portion of expenses, but the fiscal operations rely on borrowing and transfers to sustain service delivery and developmental programs.
The six-month picture points to a disciplined but deliberate expansion in priority areas, compatible with a growth-oriented fiscal stance. This shows a government actively managing revenue inflows against a growing but controlled expenditure envelope, supported by strategic borrowing and transfers.
While the six-month data lean toward a funded, policy-driven path rather than a pristine surplus, the structures in place clear reporting, deliberate allocation to capital and social programs, and disciplined debt management, signal a governance framework intent on stability and progress.